April 22, 2002; Price Charts Signal Natural Gas Buy
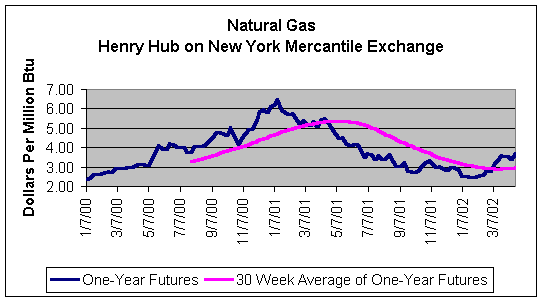
Natural gas price history for the past three years
seems to fit a classic buy/sell pattern described by the moving average
technique. When one-year futures
broke the moving average on the downside a year ago it was indeed an indicator
of a change in trend. Recently it
looked like natural gas was going to break the moving average on the upside.
That has indeed happened. Does
that mean one-year natural gas futures will gradually reach $6.00 in a year?
No one can say. We do
believe that $6.00 is possible, even likely at some point in the next several
years. The upside looks greater
than the downside and momentum is with us for now.
 |
Referred to in industry jargon as the “12 month
strip”, one-year futures represent the average of monthly quotes.
The current period of quotes covers May 2002 through April 2003.
We track closing prices on a day late in each week and compare the latest
quotes to the average of the latest 30 weeks.
The period conforms roughly to widely plotted 200-day averages of stock
prices. Using one-year futures
instead of daily cash prices reduces the distortion of seasonal factors. For example, natural gas tends to be higher-priced in winter
and refining margins tend to be higher in the spring.
One-year futures can indicate the direction of stock
prices, but are more volatile. Six-year
futures may more closely approximate stock prices by volatility.
Higher volume of trading in one-year futures may make them representative
of a wider body of opinion than six-year futures.
The weekly plot of one-year and six-year futures for natural gas and oil
that we have been running in Meter Reader in 2002 now appears in Natural
Gas Royalty Trusts – A Weekly Analysis.
April 22, 2002; Meter Reader: Momentum Works Until It Doesn't