March
11, 2002; Fundamental Price Charts Encourage Stock Buys
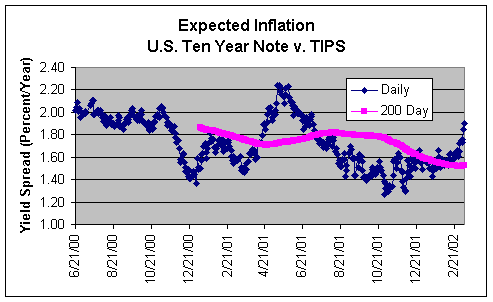
Expected
inflation has been above its two hundred day moving average consistently for
almost a month and last week the average turned up as well (see Chart).
 |
Oil
pierced the 200-day average on March 1, but the 200-day average is not yet
rising (see Chart).
 |
Natural
gas pierced its 200-day average on February 26 (see Chart). The
200-day trend has flattened and could turn up momentarily.
Earlier we had suggested that the daily price might pierce the 200-day
average in May. The sooner
happening partly reflects a better definition of the averaging period from
working days to calendar days. The
fact that such a technicality might affect the picture reminds us of the
subjective nature of price judgments.
 |
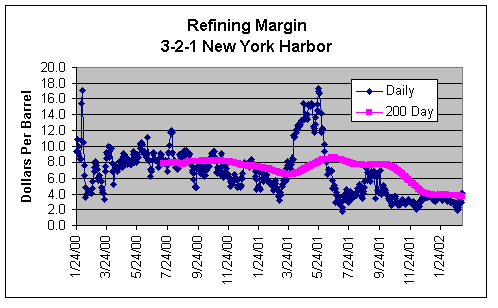
There
is good news for refiners also. The
refining margin on New York Harbor gasoline and fuel oil has pierced the 200-day
average (see Chart). Though it is
hard to detect visually, the 200-day average has also turned up.
The spring months in advance of the summer gasoline season have often
been good for refining stocks like recommended MRO.
 |